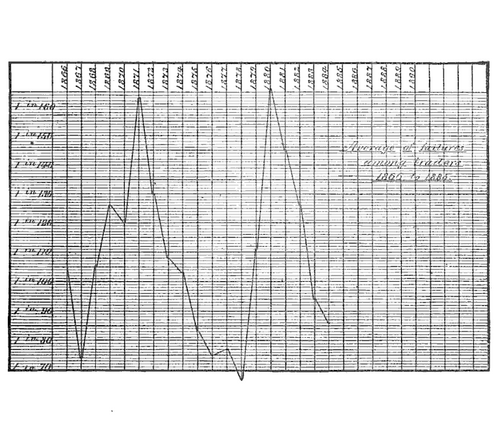
The first two chapters yield much entertainment. Smith piles on a litany of examples to show that things in motion take paths of least resistance and that many things move in cycles, though Smith called such movement smaller rhythms within larger rhythms. It is from these two claimed principles that Smith attempts to build his argument.
Smith opens with this:
In the third chapter, Smith wrote,
Later in the chapter, Smith delivered this gem:
So, after breezing through Smith's work, I began googling for data for counts on firms and failures so that I might construct a time series of survival-to-failure ratio and plot the results. Alas, that data can't be had anywhere.
The best I could find is the something the Bureau of Labor Statistics (BLS) publishes called the Quarterly Census of Employment and Wages (QCEW). The QCEW reports a count of employment and wages reported by employers to State unemployment insurance programs comprising 98% of wage and salary civilian employment in the country.
The QCEW doesn't have counts of firms nor does it have counts of failures. The worst bit, there is almost six months lag from the end of a quarter to the release of its respective data! That is so laggy to be almost useless.
However, the QCEW does have something — establishment counts! Establishment counts can stand in as a proxy as firm counts since every year for decades now, the ratio of establishments to firms has increased.
An establishment gets defined as single economic unit, such as a farm, a mine, a factory, or a store, that produces goods or services. Establishments exist at one physical location and engaged in one, or predominantly one, type of economic activity for which a single industrial classification may be applied.
OK, let's look at some pictures. First up, let's look at the quarterly change in all establishments.
If we keep in mind what Smith claimed — "the percentage number of failures to the year has been found to be always greater in the first quarter of the year than in the last three..." — we might hit on something useful.
As can be seen at the far left, the economy experienced a mild recession leading up to the heinous anti-American terrorist attack on September 11, 2001, the recession that Greenspan refused to let deepen.
The net change to Q1 2002 was -5,536 establishments. Greenspan then more than doubled up in his quest to set off the Greenspan-Bernanke Great Inflation, the greatest credit bubble in the history of mankind.
As you can see after Greenspan acted to cut rates repeated, a growth happened in Q1 establishments all the way through 2006.
The massive drop of -50,348 at Q1 2007 should have been the canary in the coalmine. And had I known about the QCEW, I could have told Americans in September 2007 that peak GDP was coming — it did by the end of Q4 2007 — and that a stock crash would happen — it did by March 6, 2009. As it is, the Q1 2008 net change of -45,789, confirmed the previous year's disastrous number.
There is another thing to notice about this graph. This graph confirms what I've been telling you for awhile, we're living in the Greatest Depression. Every net change in the Q1 establishment count from 2009 through 2014 has been negative. There is no way there can be true growth in GDP when Q1 net change in establishment counts is negative year-over-year, consistently.
Academician economists teach a false doctrine about what they call "real GDP," by which they mean trying to deflate current dollar GDP with past inflated GDP. It still shocks that few see the absurdity in that feebleness.
However, when GDP gets expressed in True Dollars™, you can see the reality of declining true GDP. The graph above supports perfectly the GDP graph below. And it is for the ongoing decline in True GDP confirmed by horrible first quarter numbers in the net change in establishments that keep Janet Yellen from doing anything about interest rates, quite likely.
Now, let's take a look at a few others.
There is two ways you could look at this chart. One way is to see that American manufacturing has been a depression for a long time. Yet, another way is to see that American manufacturing needs ever fewer establishments. To be sure, the Q1 2014 positive net change number is the first time that has happened in at least 13 years.
Q1 2007 and Q1 2008 net changes in establishment counts for construction also acted as canaries. It's likely crucial for the Q1 2015 number to come in positive.
The Information sector is leading the recovery. It should be clear that Information sector suffered for a long time from the Dot Com Bubble blow up.
And here is the chart that makes me believe the economy is going to shift into higher gears soon. Positive financial activity must come before major advance as all advances arise from the expansion of credit.
Well, we must await until mid-September for those Q1 numbers. And yes, this stuff is genius.
Say, you can hire me. If you need a C-level strategy guy who can see stuff you can't, email now.


 Gab It


